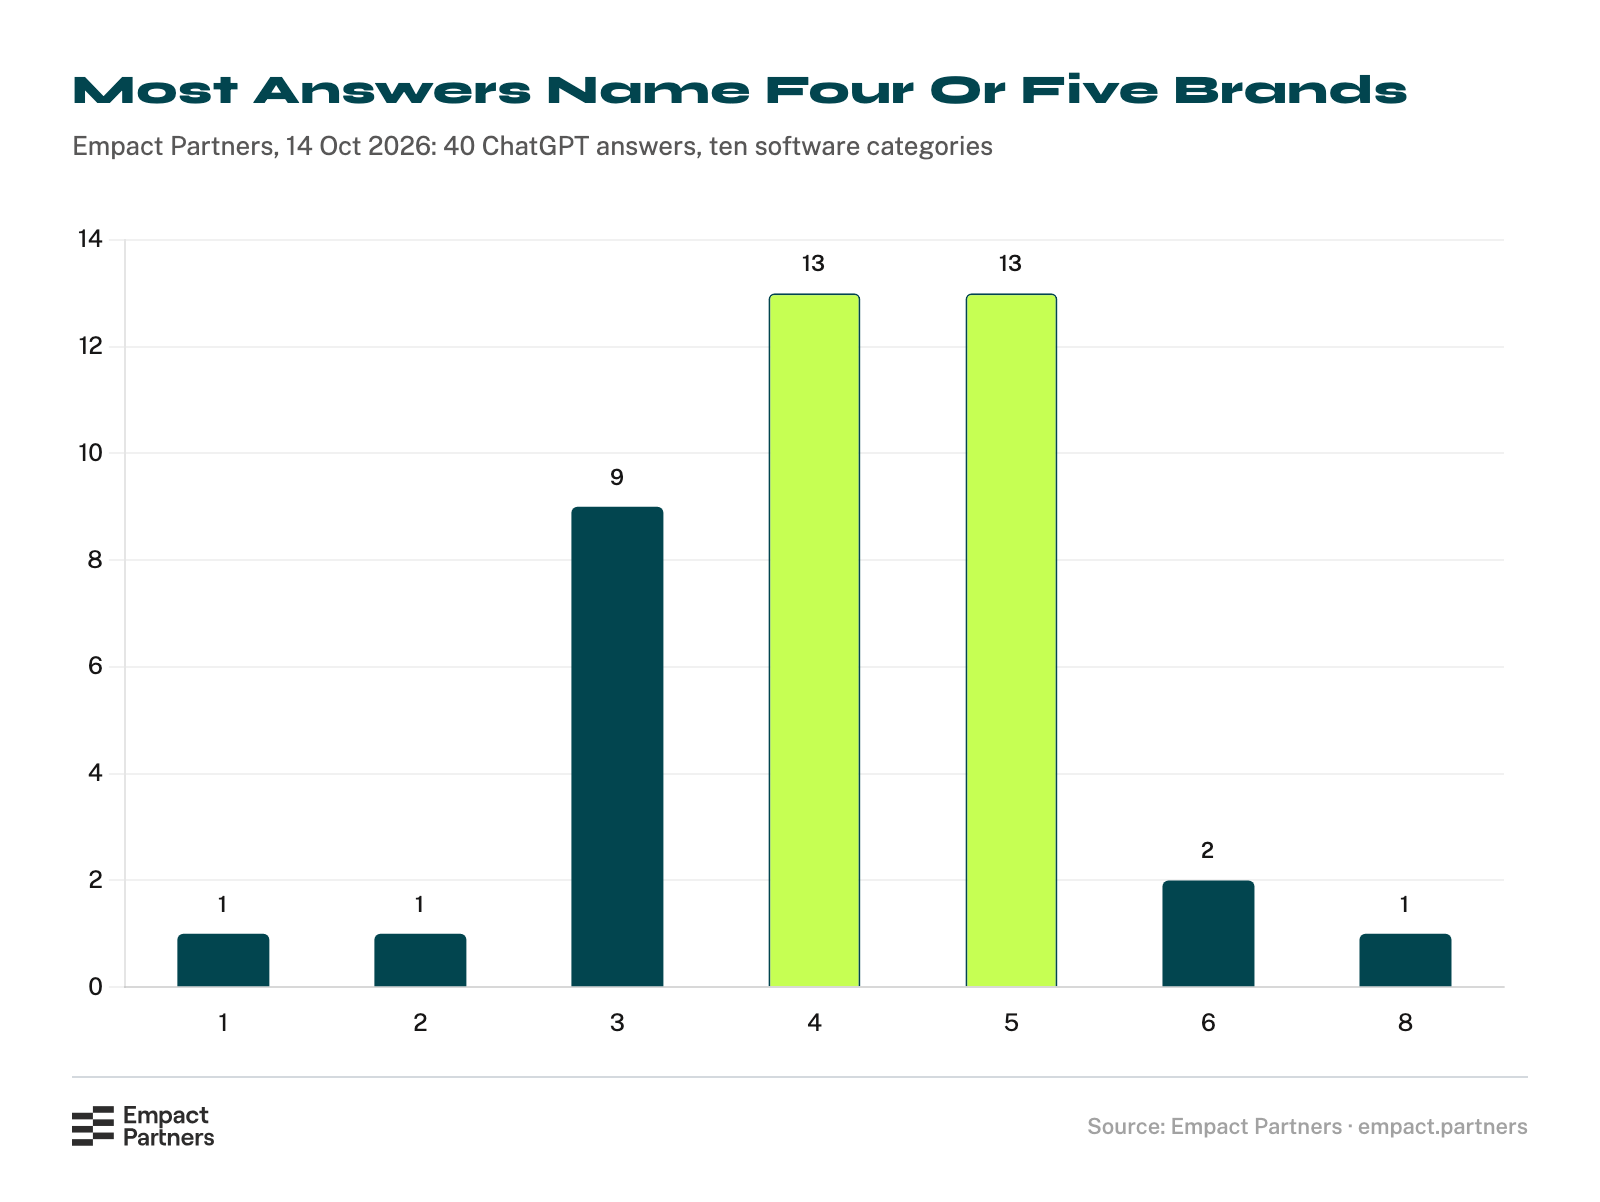
Across forty ChatGPT answers we collected in ten software categories, the median answer named four brands.1 If your category has forty vendors in it, thirty-six of them are not in that answer, and the question you asked as a yes or no turns out to have been a count.
The count is the part nobody plans for. “Are we in the answer?” is asked the way a ranking question used to be asked, as though there were a list and you were somewhere on it. There is no page two of an AI answer. There are about four seats, and they are already occupied.
Empact Partners is a go-to-market consultancy that works inside B2B software companies’ marketing teams, and the work of getting a brand into those seats is the Generative Engine Optimization workstream. That is what we do. Let’s chat.
Highlights
How Many Names An Answer Has Room For
We ran four unbranded buying questions in each of ten software categories through ChatGPT with web search on, on 14 October 2026, and counted the distinct brands each answer named.
Our own collection, in short:
[figure: chart-01]
The distribution is tighter than the range suggests. The mean was 4.2 brands per answer and the median four, with the fewest at one and the most at eight.1 Twenty-six of the forty answers named four or five.
So the shape of an AI answer is not a list that happens to be short. It is a shortlist, built to be one, and it behaves like a shortlist at both ends: it rarely runs long enough to be generous and it almost never runs short enough to be useless.
What that costs a brand depends entirely on how many vendors are competing for the seats, and the arithmetic is unkind in exactly the categories that feel most winnable:
| Vendors in your category | Seats in a typical answer | Share of vendors named |
|---|---|---|
| 10 | 4 | 40% |
| 25 | 4 | 16% |
| 40 | 4 | 10% |
| 100 | 4 | 4% |
The seat count does not grow with the category. That is the whole problem in one row: a category that doubles in size does not produce a longer answer, it produces a harder one.
One engine, one pass per question, one day, ten categories. That is enough to describe these forty answers and not enough to describe AI search, and nothing below treats four as a law.
The List Gets Shorter When The Category Gets Narrower
The categories did not behave alike, and the spread between them is wider than the spread inside most of them.

[figure: chart-02]
Password managers came back with 2.5 brands on average and inventory management with 5.25.1 One password-manager answer named a single brand and stopped.
Four answers per category is a small cell, so read this as a direction rather than a ranking of categories. What the direction says is worth sitting with anyway, because it inverts the usual instinct.
A narrow category looks like an easier room to get into. Fewer competitors, less noise, a shorter list to join. The count says the opposite: the list is shorter too, so the same brand is competing for two seats rather than five.


Almost Every Answer Names Somebody
The question partners ask next is whether answers sometimes name nobody at all, and ours cannot tell you, because every question we ran asked for a recommendation. A set built that way will always produce names.

Our sister company Qvery measures this properly. Qvery runs a brand’s own buying questions daily on ChatGPT and Google AI Mode across 200+ countries and captures every citation tied to the query and the engine that produced it, which makes its corpus the one to ask.
Qvery’s study, in short:
[figure: chart-03]
Pooled across both engines, 98.00% of project management answers and 98.50% of CRM answers named at least one brand.4 Which settles the question in the least comfortable direction.
The failure mode is not an empty answer you could fill. It is a full answer with four other names in it. Almost nobody is losing to silence.
The Human Shortlist Is The Same Length
Set the machine’s number beside the one the buying research has been reporting for years, and the two land in the same place.
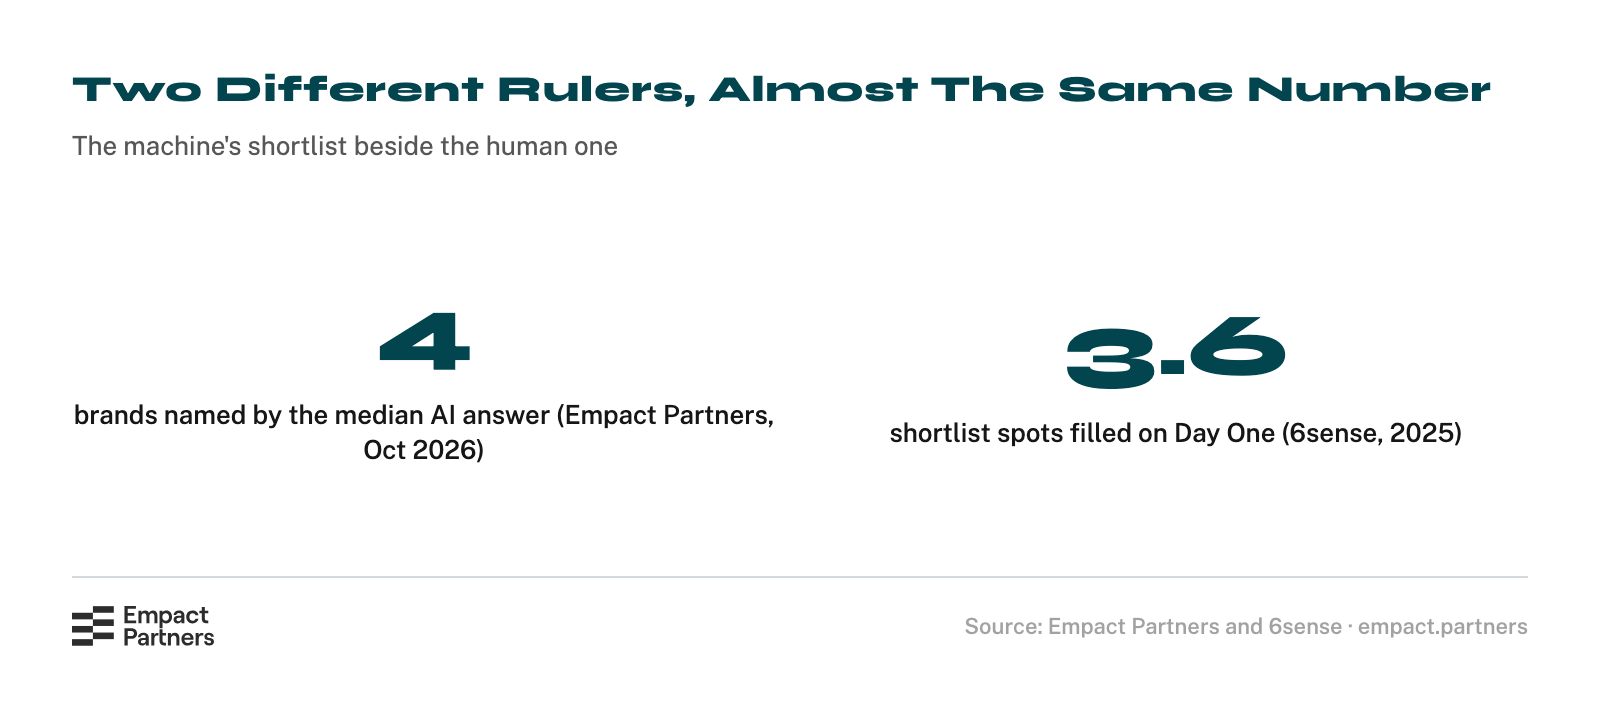
6sense surveyed nearly 4,000 B2B buyers for its 2025 report. Buyers evaluate an average of 5.1 vendors, have prior experience with 3.8 of them, and fill 3.6 shortlist spots on Day One of the journey.2
[figure: chart-04]
Then the figure that gives the whole thing its weight: 95% of the time, the winning vendor was already on that Day One shortlist, and four deals in five go to the pre-contact favorite.2
These are two different rulers. 6sense asked people what they did. We counted what an engine wrote. That both land near four is a convergence worth noticing and not evidence that one causes the other, and nothing here claims it does.
What the convergence does mean is that the two shortlists are now the same object in practice. The engine assembles a list of about four. The buyer keeps a list of about four. The winner comes off it.
Which Is What Makes It Zero-Sum
G2 surveyed 1,038 B2B decision-makers in June 2026. More than eight in ten had sourced software recommendations from an AI chatbot in the previous two years, and about half of those said AI had its greatest influence during shortlisting and evaluation.3
[figure: chart-05]
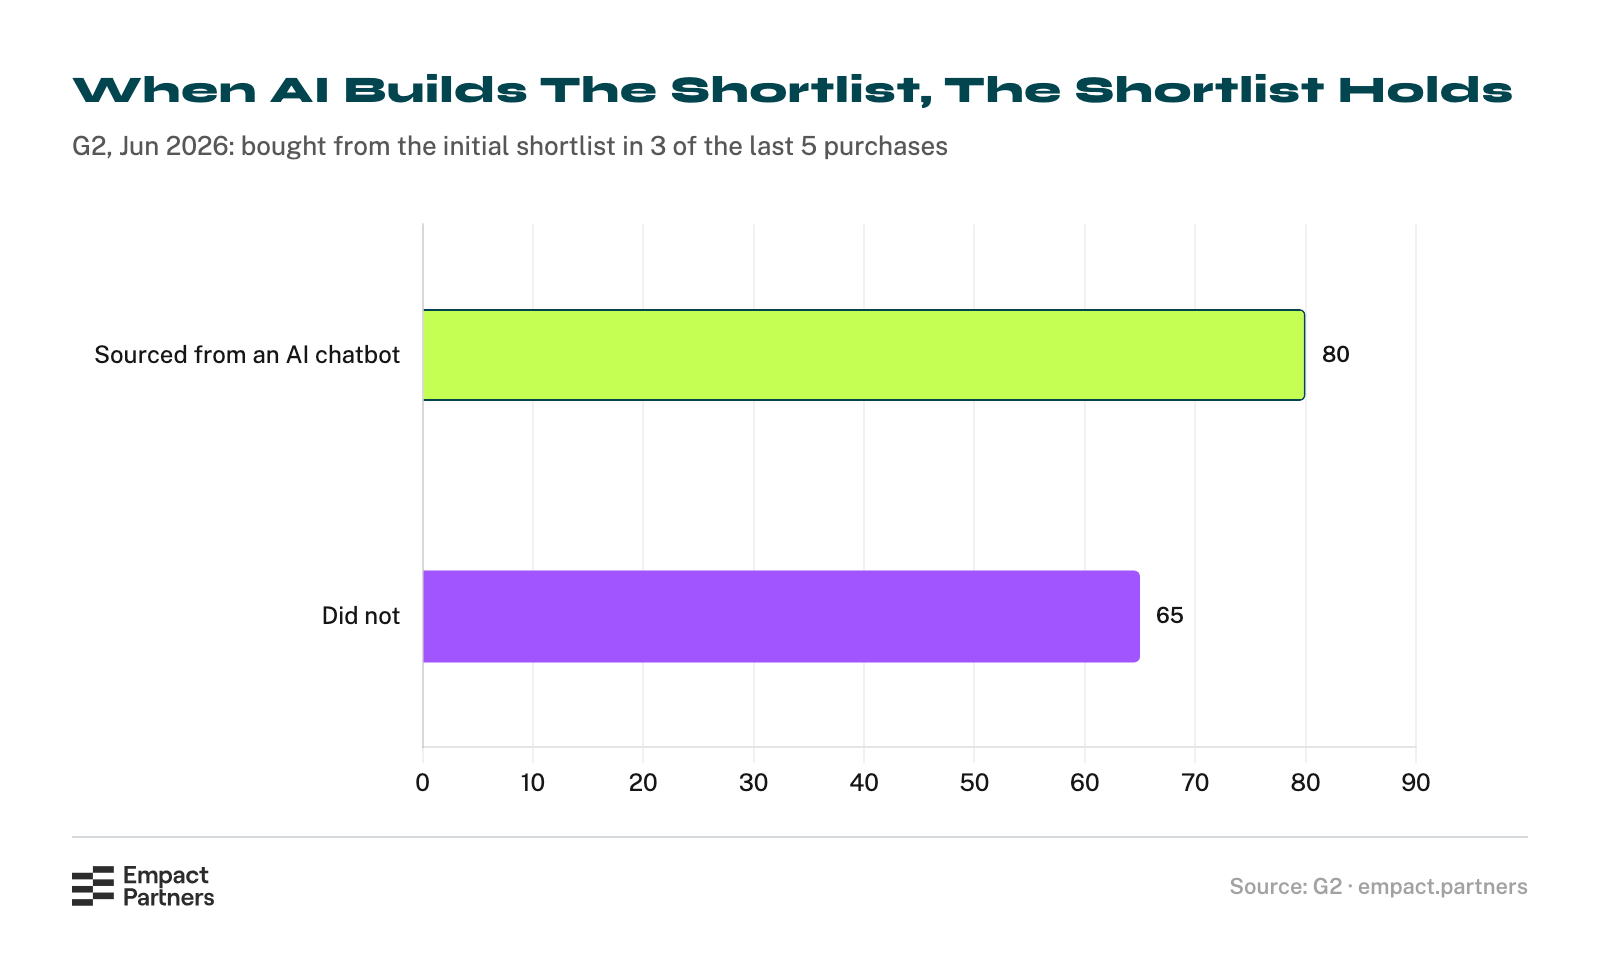
The comparison inside that survey is the one to take to a budget meeting. Buyers who sourced recommendations from AI chatbots bought from their initial shortlist 80% of the time, in at least three of their last five purchases. Buyers who did not: 65%.3
G2 reports that as an association between two groups of its respondents, and it is worth keeping it that way rather than reading it as proof that AI closed the list. The direction still matters: where AI builds the shortlist, the shortlist holds harder.

Which is the sentence a competent buyer should argue with, so here is what it rests on and what it does not. It rests on three independent measurements agreeing about the size of the list. It does not rest on any claim that an engine’s shortlist causes a purchase, because none of these sources tested that.
It helps to be precise about what changed, because “AI killed SEO” is not it. A ranked list of ten blue links was also a shortlist, and it was also won at the top. The difference is what happens to the brand in eleventh place:
There is one more reason not to read the engine as the whole story. In the same G2 survey, review sites influenced shortlist decisions for 38% of buyers and AI chatbots for 37%.3 Those are within a point of each other, and we are not going to rank them for you.
The Round You Are Missing Is The One That Got Longer
There is a second shift in the same G2 survey that makes the seat count matter more than it would have two years ago. The work did not disappear from the buying journey. It moved.
Put those together and the shape of the contest changes. The stage where a brand could still be discovered compressed, and the stage where a brand is scrutinised expanded. Everything after the shortlist is now a longer, harder process between four names, and none of it is available to a brand that is not one of them.
Agents sharpen the same point. Among buyers using them, building shortlists of top vendors is already one of the two most common tasks at 51%, level with comparing total cost of ownership.3 The list is increasingly assembled by something that will not be charmed into adding a fifth name.
A Few Names Hold Most Of The Seats
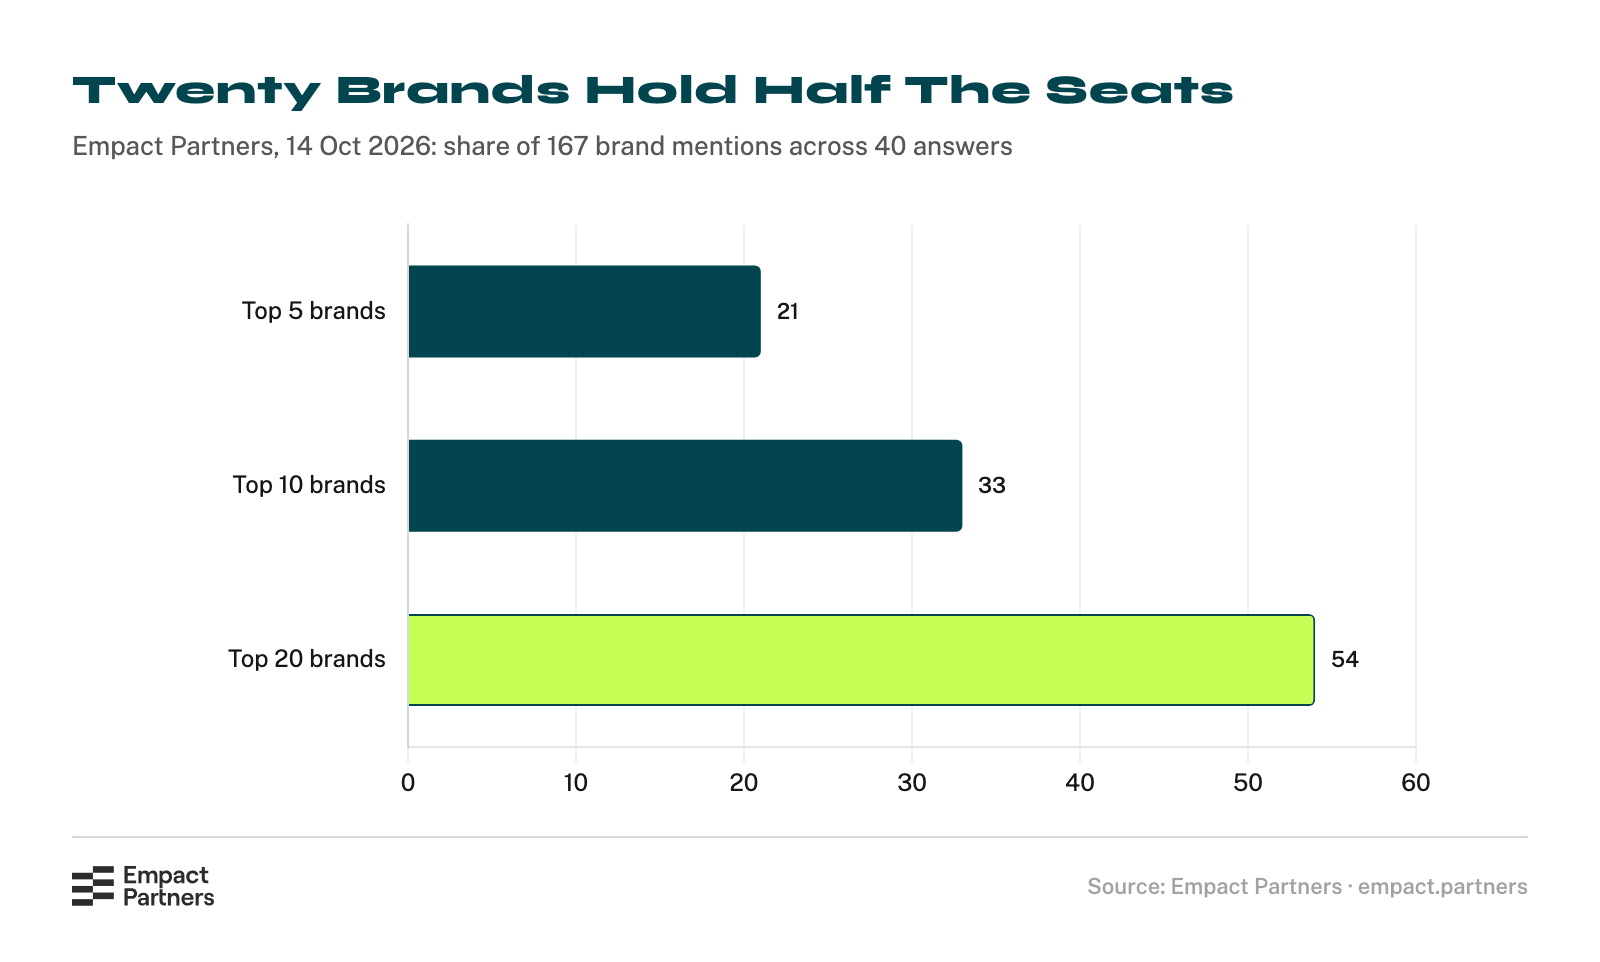
Across our forty answers, 69 distinct brands shared 167 seats.1 That sounds like a wide field until you look at how the seats are distributed.
[figure: chart-06]
The top five brands took 21% of all the seats, the top ten took 33%, and the top twenty took 54%.1 The remaining forty-nine brands split the rest.
A caution about our own method, because it shows up in that chart. Our rule collapses a vendor’s products into one brand, so Zoho CRM, Zoho Books and Zoho Inventory count as Zoho, which is why Zoho appears in 30% of answers.1 That is a suite in three categories, not one product winning three answers in ten, and we would rather show you the rule than quietly smooth it.
Half the field is competing for the back half of a list four names long, so the long tail here is not a place to build from. Qvery’s recurrence test gives a sense of how fixed the front of it is: asking the same unbranded questions five times over, four project management brands made every run’s top five, while in CRM only two did.4 Which makes them different problems:
Qvery measured the same concentration from the other side. In CRM answers, HubSpot’s own domain was cited in 35.20% of them, Pipedrive’s and Zoho’s in 26.40% each and Salesforce’s in 24.00%, while the leading non-vendor source reached 6.40%.5
Two different measurements sit close enough together to be confused, so here they are apart:
What Displacing A Name Takes
Our own view, from running this work: the first quarter is not a campaign, it is three separate pieces of plumbing, and teams usually try the third one first.
Qvery’s own study of recurrence is honest about what it does not show, and so are we: it tested whether a recurring set of named brands exists and did not identify any action that gets a new product into one.4 Nobody has published that proof, including us.
The order matters more than it sounds. A team that starts with the discussion layer is working the slowest surface with no way to tell whether anything moved, because its question set was never built to measure the category it sells into. A team that starts with the question set gets a number it can defend in eight weeks, and the number tells it which of the other two to spend the rest of the quarter on.
What a first quarter honestly produces, if all three are run in that order:
So the quit point is worth naming before a budget is committed. If a category’s answers hold the same four names every run, breaking in is a multi-quarter project and a one-quarter budget will buy a measurement rather than a result. The measurement is still worth having. Mistaking it for the result is the expensive part.
If your category’s answers come back with four names and none of them is yours, that is the problem I would want to look at first. Book time with me and we will work out between us whether it is work for Empact Partners.
Sources
- Empact Partners, brands-per-answer collection, 14 October 2026. Forty ChatGPT answers across ten software categories. Method and limits in the article’s own data folder.
- 6sense, 2025 B2B Buyer Experience Report. Nearly 4,000 B2B buyers, 2025.
- G2, 2026 Buyer Behavior Report. 1,038 B2B decision-makers, June 2026.
- Qvery, Have AI Engines Already Settled Your SaaS Category’s Top 5?. Two categories, five runs each, September 2026.
- Qvery, Your SaaS Category’s AI Answers Run on Vendor Sites, Not Review Sites. Two categories, August 2026.