Marketing spend at US companies grew 1.7% over the past year, while the digital spending inside it grew 8.2%.1 When one line grows almost five times faster than the total, the rest of the budget grew more slowly than 1.7% or shrank.
So the brand question for 2026 isn’t whether to fund it. It’s where the brand half of a budget that didn’t grow should go, and what each channel costs and returns once the money lands. That question is where our Brand Marketing work at Empact Partners starts, and these are the numbers I’d want on the table before answering it.
Highlights
Read together, they describe a buyer who mostly chooses from a list made before any search, a budget that isn’t growing to reach that buyer, and channels moving in opposite directions. The ones you pay per click for are getting dearer, and the ones a buyer reads alone are taking share.
The newest of them, the AI answer, leans hardest on the vendor’s own pages. That makes the message on those pages a budget line, whether or not it’s in the plan.
Most B2B Buyers Aren’t Shopping When Your Brand Reaches Them
John Dawes of the Ehrenberg-Bass Institute made the case for the LinkedIn B2B Institute as arithmetic rather than a survey, and he’s careful to call his headline a heuristic:
How often a category gets bought moves those numbers up or down.

Those buyers aren’t blank when they do start. TrustRadius asked 2,058 technology buyers in January 2025 about their last purchase, and 79% already knew the product they bought before their research began.9
Bain, writing in June 2026 with LinkedIn’s analysis behind it, puts the end of the process plainly: around 90% of buyers purchase from their Day 1 list, and hidden buyers hold half of the influence over that decision.3
Hidden buyers are the people in finance, legal, procurement and operations who may never use the product or sign the contract. In Edelman and LinkedIn’s 2025 study, 71% of US hidden decision-makers said they have relatively little or no interaction with sales, answering never, rarely or occasionally.10
.png)
If the list forms before anyone shops, brand spend has to reach people who won’t convert this quarter. That’s a hard thing to fund when the total doesn’t move.
Budgets Are Flat, So the Brand Decision Is Where the Money Goes
Gartner’s 2026 CMO Spend Survey asked 401 marketing leaders, most of them at companies with more than $1 billion in revenue, and found budgets at 7.8% of company revenue, against 7.7% in 2025. 56% of CMOs said they lack the budget to deliver their 2026 strategy, and the average budget now puts 15.3% into AI initiatives.4
The CMO Survey asks a different population, US marketing leaders, and lands at 9.0% of revenue.1 Don’t average the two. The useful reading is Gartner’s, because it asked the same kind of leaders a year apart and the line barely moved.
The bigger spread is by industry. In The CMO Survey’s 2026 breakout, B2B product companies spend 7.02% of revenue on marketing and B2B services firms 10.07%, and among the business-facing industries with at least a dozen respondents, tech and software sits highest at 10.56% of revenue.5

Inside those budgets, marketers expect digital to grow fastest over the next twelve months and brand building to grow more slowly. B2B product firms expect digital to rise 9.37% and brand building 5.14%. B2B services firms expect 8.82% and 8.31%, nearly level, and across all companies the two lines sit at 10.4% and 5.87%.5

My read is that services firms sell a team and a reputation, and they budget as if they know it. Product firms are leaning on the channels that report fastest, which is the pull every marketing leader feels this year.
The long-run evidence for where the brand line should sit is thinner than its fame. Les Binet and Peter Field’s B2B cut of the IPA Databank rests on fewer than 50 B2B campaigns run between 1998 and 2018, mostly British and mostly big-budget:
The authors call the findings tentative and say the ratio shouldn’t be followed too precisely. That’s the long game, and the short game is pulling hard against it. When profits miss, marketing is the expense cut 45.4% of the time, and 70.6% of marketing leaders say their response to pressure is a shift toward short-term impact.1
So if the total isn’t moving and the pressure runs short-term, the fight is over the mix. The place to start is the line most budgets lean on hardest.
Search Clicks Cost More and Get Clicked Less
Bain reported in March 2025 that search click-through rates had fallen by as much as 30% in some B2B categories, B2B software among them, in the year after Google added AI summaries.12 Bain didn’t publish its method on that page, so read it as a direction.
Dreamdata’s 2026 benchmarks, built on more than 66 million sessions and 3.5 million customer journeys from its B2B customers, show the same direction with a method behind it, comparing 2025 with 2024:
Those customers paid more for each generic click, got fewer of them, and moved money away.
Across the wider search market, the click keeps getting dearer. WordStream and LocaliQ’s benchmarks, medians from US search campaigns on Google and Microsoft Ads, put the average cost per click at $5.42 against $2.32 a decade earlier.13
The median cost per lead across all industries was $70.11 in the year to March 2025.14 By industry, the 2025 and 2026 reports tell a softer story:13
| industry | median cost per lead, Apr 2024–Mar 2025 | Apr 2025–Mar 2026 |
|---|---|---|
| Business Services | $103.54 | $93.69 |
| Industrial & Commercial | $85.63 | $75.19 |
| Finance & Insurance | $83.93 | $74.44 |
| Education & Instruction | $90.02 | $77.48 |
Lead costs fell in all four, and WordStream reports conversion rates rising in 87% of industries over the same year while the median click got dearer.13 Medians don’t compose neatly, so cost per lead isn’t simply cost per click divided by conversion rate here. Read the table as a direction: in this sample, the search lead got cheaper while the click didn’t.
The channels that push are losing ground too. Only 14% of buyers now consult analyst reports, a 60% drop since 2022, in TrustRadius’s data.9 Gartner’s survey of 632 B2B buyers found 73% actively avoid suppliers who send irrelevant outreach.15
And The CMO Survey’s respondents expect traditional advertising to be the one line that shrinks, by 1.5% over the next twelve months and by 2.16% among B2B services firms.5 The lines gaining share in the next set of figures have one trait in common: a buyer reads them without a seller in the room.
The Channels Gaining Share Are the Ones Buyers Read Without a Seller
LinkedIn now takes 41% of B2B ad budgets among Dreamdata’s customers, the largest single line.6 The Content Marketing Institute’s survey of 1,015 B2B marketers, fielded in mid-2025, points the same way on the organic side:
The money is going to formats a buyer opens on their own time, and the AI line is reaching production faster than it’s reaching results.
Thought leadership earns its line with the people sales can’t reach. In Edelman and LinkedIn’s US data, 95% of hidden decision-makers say strong thought leadership makes them more receptive to outreach, and 64% trust it more than marketing materials and product sheets.10
The fastest-rising place buyers read without a seller is an AI answer, and two buyer surveys measure it from different angles:
Marketers are following, faster on tools than on anything else:

In The CMO Survey, AI’s share of marketing activities rose from 13.1% to 24.2% between 2024 and 2026, and generative AI’s from 7% to 22.4%. 41.5% of companies already use Generative Engine Optimization (GEO), the work of getting content into AI-generated answers.1
Social sits beside it. Social media takes 14.3% of marketing budgets in The CMO Survey.1 By sector, that’s 9.5% among B2B product firms and 15.65% among B2B services firms.5 One caution from the same survey: from 2009 to 2026, marketers’ twelve-month forecasts of social spend overshot what they spent by 2.1 percentage points on average.1
Reddit is the community line moving fastest. In HubSpot’s State of Marketing 2026, brands engaging on Reddit went from 11.3% to 15.4% in a year.18
Return Is Published by Channel, Not by Industry
The question every budget meeting wants answered is which channel returns most in its industry. I haven’t found a method-backed table of marketing return by industry, and I won’t print one that isn’t. What exists is return by channel, from one vendor’s dataset, and spend and cost by industry, which is half the equation.
Dreamdata’s attribution model puts LinkedIn’s return on ad spend at 121% across its customers in 2025, Google Search at 67% and Meta at 51%. For its top-performing customers, the same channels returned 279%, 138% and 133%.6
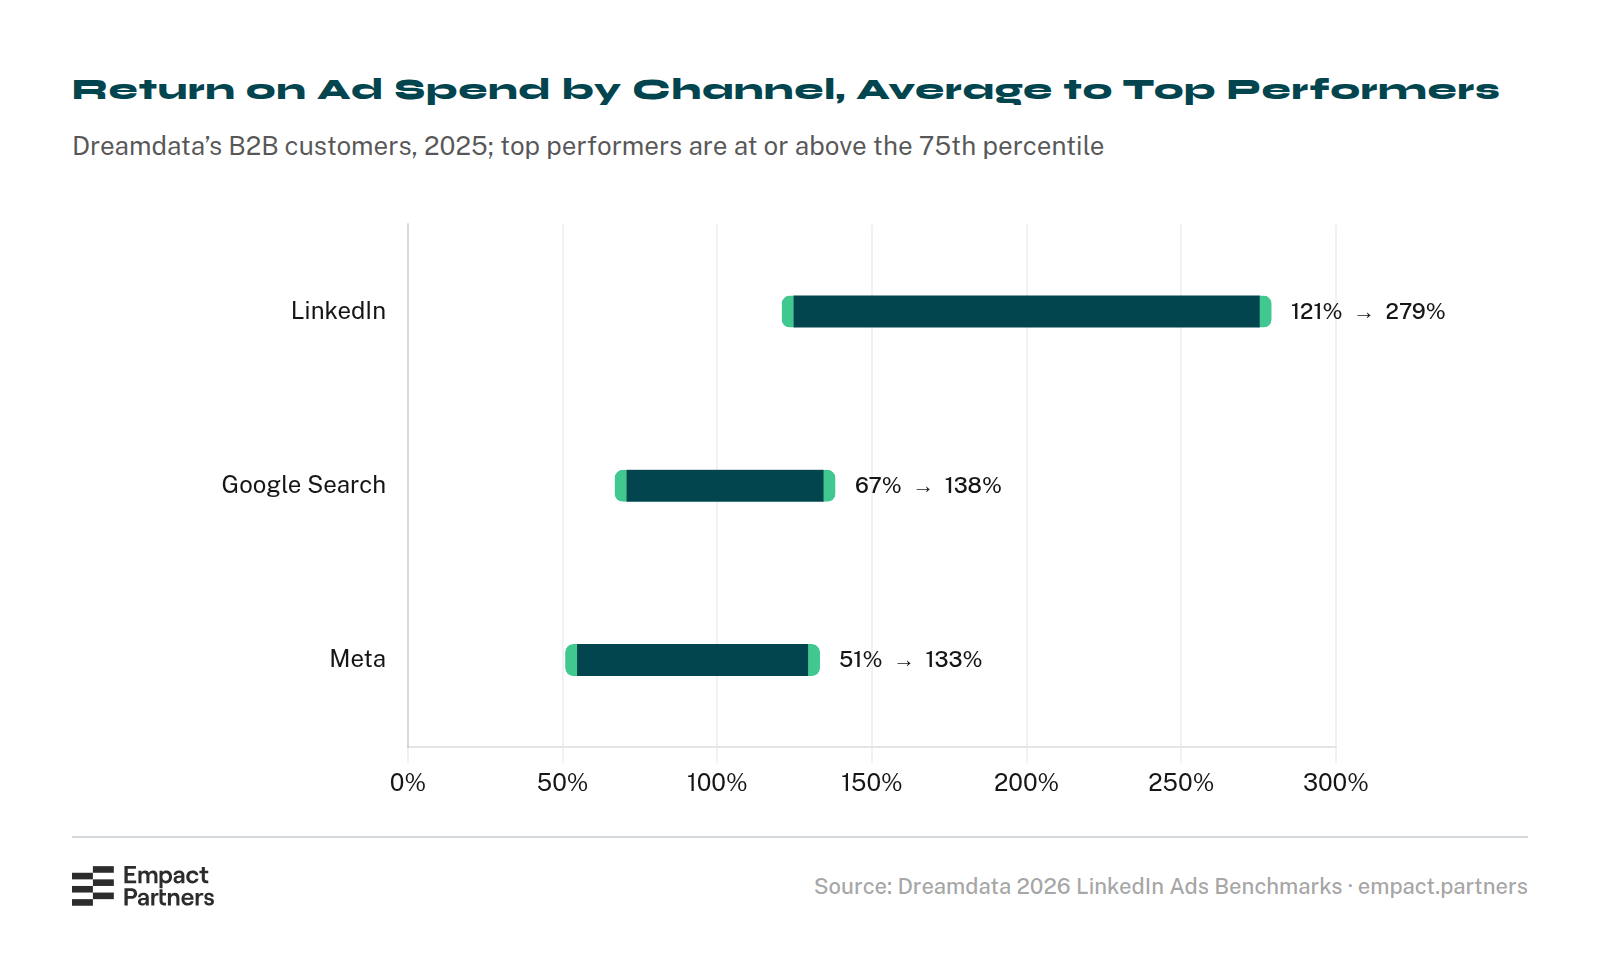
LinkedIn also cost less per company influenced: €70.11, against €110.37 for Google Search and €128.70 for Meta.6 The catch is time. Dreamdata’s average from first ad impression to revenue is 281 days, just over three quarters, so a brand budget judged quarter by quarter gets judged before much of its return can land.
Ask marketers instead of measuring them and the ranking changes. In HubSpot’s State of Marketing 2026, B2B marketers put website, blog and SEO first for ROI, named by 30.2% of them, then email (23.6%) and paid social (23.3%).18 That’s self-reported with no fieldwork dates published, so it measures belief.
Our own numbers come one partnership at a time, and Empact Partners publishes two that show a channel’s return from the inside:
The views and the mentions are separate numbers on purpose. Reach is what a channel sells. A mention is the brand saying something specific enough to be repeated, and that part was decided before a single thread went up.
Ranking First in Google Gets You Cited Less Than Half the Time
The newest channel on the list is one nobody can buy a placement in. We measure it through Qvery, our sister company, whose AI agents have captured 716,821 ChatGPT and Google AI Mode answers to the questions it tracks since late 2025.21
Qvery is ours, so weigh what follows accordingly. Each finding links to the Qvery article that publishes it, method included, so you can check it yourself.
Two of its studies set the frame for any channel plan:
Ranking first and being cited are different things. The G2 study also compares every vendor site with a single review platform, which exaggerates the gap, but most answers still drew on vendors’ own pages.
The channels feeding those answers move fast, and the two engines don’t move together. Between January and April 2026, ChatGPT’s citations to social media platforms collapsed while Reddit’s grew:22
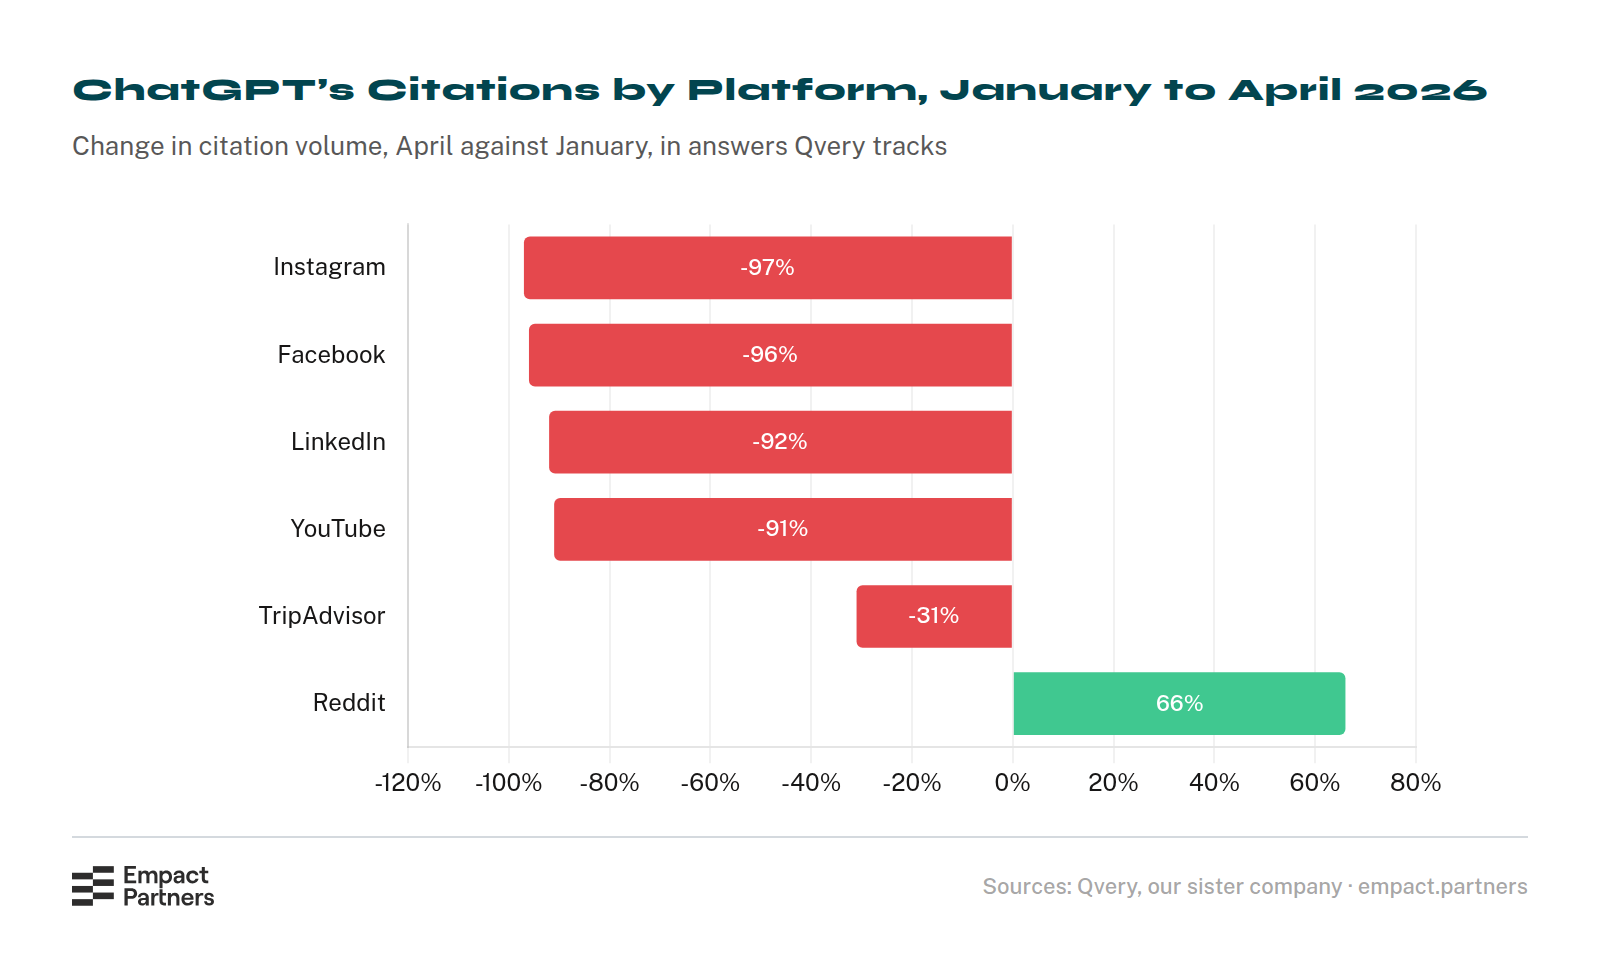
Over the same months Google AI Mode went the other way, citing YouTube 5.2 times and LinkedIn 2.1 times as often in April as in January.22 Reddit shows how fast a single source can swing:
A channel plan built on what one engine cited in the spring was out of date by the summer.
The shortlist itself isn’t settled everywhere. In Qvery’s check on whether a SaaS category’s AI shortlist is already set, five same-day runs put the same four brands in every top five for project management and only two for CRM.25 Two categories and five runs is a sample, and it says some lists still have room.
What Brand Marketing Decides Before GEO Distributes It
Most of what an AI engine cites about a vendor is the vendor’s own words, so the words had better agree with each other. Gartner found 69% of B2B buyers report inconsistencies between a supplier’s website and what its sellers tell them.15
.png)
A company that doesn’t define what it is and what it stands for gets a version invented by its employees and its buyers. We’ve opened positioning workshops with that line for years, and the 69% is the invention, measured from the buyer’s side.
We’re a go-to-market consultancy, and Brand Marketing is one of six workstreams we run for B2B software companies from inside their own teams. It opens on that problem before any channel: a time-boxed read of ten or twelve competitors, indirect ones included, then the positioning, built in an order where each step constrains the next:
The message then goes where buyers and engines read it: the About page, the product and solutions pages, the sales deck, the CRM’s qualification filters, and the category chosen for directory listings. A website audit follows, because the site is where buyers meet the message before a seller can explain it.
Content can carry a vendor further than its name. In Edelman’s write-up of its LinkedIn study, 53% of hidden buyers say strong content can outweigh brand recognition alone.26 Two partnerships we’ve published show the message work that sits underneath that kind of content:
That’s where Brand Marketing hands off to Generative Engine Optimization, our GEO workstream, which takes the settled message to the places engines read. Its formula is GEO = UGC + Mentions: the threads where users talk about you and the third-party pages that name you. Distribution repeats a message, and an unsettled one gets repeated faster.
Where the Brand Half Goes in 2026
Here’s my verdict for 2026, and it could turn out wrong. Keep brand near half the budget, knowing the only long-run B2B evidence for that split rests on fewer than 50 campaigns.
Then judge each brand line by two tests: does it reach buyers who won’t be shopping this quarter, and does it leave words about you somewhere an AI engine reads? LinkedIn, thought leadership and your own product pages pass both. Generic search terms pass neither, however cheap their leads looked this year.
If you’re setting next year’s brand budget and the message underneath it isn’t settled yet, book a call with me, and let’s see whether we could work together.
Sources
- The CMO Survey (Duke University’s Fuqua School of Business, Deloitte and the American Marketing Association), “The CMO Survey: Highlights & Insights Report”, report, 2026.
- LinkedIn B2B Institute and the Ehrenberg-Bass Institute (John Dawes), “Advertising Effectiveness and the 95-5 Rule: Most B2B Buyers Are Not in the Market Right Now”, report, undated.
- Bain & Company, “Raising the Odds on a Deal: How Likelihood to Buy Rewires B2B Growth”, brief, 2026.
- Gartner, “Gartner 2026 CMO Spend Survey Finds CMOs Allocate 15.3% of Marketing Budgets to AI, But Only 30% Are Ready to Scale AI Capabilities”, press release, 2026.
- The CMO Survey, “The CMO Survey: Firm and Industry Breakout Report”, report, 2026.
- Dreamdata, “Announcing The 2026 LinkedIn Ads Benchmarks Report by Dreamdata”, 2026.
- Qvery, “AI Engine Citations vs Google Organic SERPs: Only 13.9% Overlap”, 2026.
- Qvery, “How Often AI Answers Cite G2 for SaaS: Mostly on Recommendation Questions”, 2026.
- TrustRadius, “Bridging the Trust Gap: B2B Tech Buying in the Age of AI”, report, 2025.
- Edelman and LinkedIn, “2025 B2B Thought Leadership Impact Report”, report, 2025.
- LinkedIn B2B Institute (Les Binet and Peter Field), “The 5 Principles of Growth in B2B Marketing: Empirical Observations on B2B Effectiveness”, report, 2019.
- Bain & Company, “Losing Control: How Zero-Click Search Affects B2B Marketers”, snap chart, 2025.
- WordStream and LocaliQ, “Google Ads Benchmarks 2026: Competitive Data & Insights for Every Industry”, 2026.
- WordStream and LocaliQ, “Google Ads Benchmarks 2025: Competitive Data & Insights for Every Industry”, 2025.
- Gartner, “Gartner Sales Survey Finds 61% of B2B Buyers Prefer a Rep-Free Buying Experience”, press release, 2025.
- Content Marketing Institute and MarketingProfs, “9 Takeaways and Insights From the 2026 B2B Content and Marketing Trends Report”, 2025.
- Forrester, “B2B Buyers Make Zero-Click Number One”, blog, 2026.
- HubSpot, “The Top Marketing Channels of 2026, According to Marketers [Data]”, blog reporting the State of Marketing 2026 survey, 2026.
- Empact Partners, PDF Reader Pro case study, our partnership record from June 2023, read 12 October 2026.
- Empact Partners, KKday case study, our three-month Reddit program from late 2024, read 12 October 2026.
- Qvery, our sister company: ChatGPT answers captured since 28 October 2025 and Google AI Mode answers since 18 December 2025, counted in Qvery’s database on 19 September 2026.
- Qvery, “Social Media in AI Search: ChatGPT vs Google AI Mode”, 2026.
- Qvery, “98% of UGC Citations in AI Search Come From Just Four Platforms”, 2026.
- Promptwatch (Klaas Foppen), “Reddit Citations Are Dropping in ChatGPT”, data report, 2026.
- Qvery, “Have AI Engines Already Settled Your SaaS Category’s Top 5? Check Before You Try To Break In”, 2026.
- Edelman (Joe Kingsbury), “The Rise of the Hidden Buyer: Rethinking B2B Influence Beyond the Obvious”, article, 2025.